Query Builder
You can create queries without writing SQL yourself by using ActionKit’s point-and-click query builder interface. To use the query builder, click Add a Query… on the reports page and choose a query type, such as Users. Doing so reveals two new areas, Display and Filters, which you can use to define your report. As you make selections in those two areas, the query builder generates the corresponding SQL.
The Display area lets you choose the columns to be displayed when you run the report. Each display column corresponds to an expression in the SELECT clause of the generated SQL. The Filters area controls which database rows will be included in the report. These choices are used to determine the WHERE criteria in the generated SQL.
You can also enable the query builder on an existing custom SQL report by clicking Enable Query Builder and then changing the Query Type field from Custom SQL to one of the query-builder types. However, turning on the query builder for an existing report and changing the query builder type will erase any SQL query you may have entered before.
When you are using the query builder, you can not edit your SQL directly. However, you can use the query builder to begin defining a query, and then select Custom SQL to make further changes to the query before saving it.
Note that while the query builder can generate many types of queries, it does have some limitations: there are some queries it can’t generate, and some of the queries it generates are less efficient than the ones an expert would write by hand. As a result, it’s still important to have someone on your team who can write SQL queries directly.
Query Builder Report Types
The types available are listed below, along with definitions of some key terms:
Users: Use to view counts of users, subscribers, and donors in total or by category. Categories include user source, # of actions, location, political district, donation total, and list membership. Or, view a list of users with details like contact information, source, total action and donation counts. Limit to donors, new users, event hosts, users in a particular state or with a particular occupation, large donors, super actives, etc.
Actions: Use to view counts of actions, action takers, users created, users subscribed and TAF emails sent in total or by category. Categories include page, tag, action source, target, and action date or time period. Or see a list of actions with details like id, date, source, action field values like a user-entered comment or survey answers, and action taker info like name and phone number. Filter by page, tag, multilingual campaign, target, etc.
Donations: Use to view counts of orders, payments (completed orders of more than $0), and donors as well as the sum and average of payments. View these totals broken down by page, donation source, type (one-time or recurring), donation status, donor address, etc. Or view a list of orders with related details like amount, account, status, products, donor name and address. Includes recurring, one-time and product orders. See Understanding Donation Data for more details.
Events: Use to view counts of event campaigns, individual events, and event hosts and attendees, in total or by category. Categories includes the campaign name and time period and the # of sign ups. Or view a list of event campaigns or individual events with related details like venue. The event campaign is the umbrella for a set of related individual events. For one-off events the campaign will be the same as the event.
Mailings: Use to view counts of mailings, and performance stats like total opens, clicks, actions, etc. View stats by mailing, by tag, by subject.
Transactional Mailings: Use to view information about emails that are prompted by a user action, such as after-action confirmation emails, client-configured notification emails, and tell-a-friend messages sent via the server. Provides performance stats like total opens, clicks, actions, etc. View stats by page, by type, or by subject.
Pages: Use to see detailed information about pages. This builder type has some overlap with the actions type. Pages makes it easy for you to recreate the performance by page report with the columns you’d like to see.
Clicks: Use to generate traffic reports showing information about the visitors to your action pages, including any source codes in the links they clicked, whether they’re coming from mailings or share links, and which types of browsers and devices they’re using.
Products: Use to see detailed information about products.
Targets: Use to see detailed information about advocacy targets, including what groups a target belongs to and vice versa, whether and who is shown as the legislative director, and what types of signature delivery the target can receive.
Media: Use to see detailed information about the newspapers in our database for LTEs.
Languages: Use to see which languages you’ve created and details of their translation phrase.
Report: Use to retrieve information about the reports in your ActionKit instance.
Staff: Use to report on staff accounts including their permissions and whether they have two-factor authentication enabled.
Understanding Donation Data
Donations are complicated! We’ve simplified things a bit in the query builder so you can get the number you want without having to fully understand the data structure. For example, you don’t need to know how the core_order and core_transaction tables relate to get a count of one-time donations broken down by final disposition: successful, failed or reversed.
However, it’s still helpful to have a basic understanding of how donation processing works and the terms we’ve used:
A new donation is processed through one of your donation pages or imported through an import page using the uploader. Either way, an action is created as well as an order. If this is a new recurring donation, a recurring order is also created. Product orders are considered a type of donation, even if the product doesn’t cost anything (and that’s how you might end up with a $0 order).
When the donation is submitted to your merchant vendor or imported through the uploader a transaction is created. Future payments toward a recurring commitment (or profile) create new transactions, but not new orders or recurring orders.
Related terms:
Order - Any donation or product order attempt.
Transaction - A record of each successful order (whether imported or processed through ActionKit) as well as other interactions with your merchant vendor like refunding a donation or creating or canceling a recurring profile.
Payment - Money went into your account! Any successful donation or product order for more than $0. A recurring donation will have many associated payments. Imports are counted as payments.
Recurring profile - Each new recurring donation commitment gets a new recurring profile ID. One donor may have multiple profiles. Changing the amount or credit card information for a profile does not generally create a new profile.
Detail about processing and the data structure for donations is available for those who want to learn more under data capture details by category.
Choosing A Report Type
Each query builder focuses on a certain type of data, but can also pull in other types of related data. As a result, sometimes it’s not obvious which query builder type to use; for example, if you want a count of how many users are on each list, should you start from Users or from Lists?
Here are a few rules of thumb for these cases:
If you need additional fields from one table (like the user’s home country, or the list’s creation date), start with it.
If you need unmatched rows from one table (like users not on any list, or lists without users), start with that.
Sometimes, either will work but the queries generated by one of them are faster.
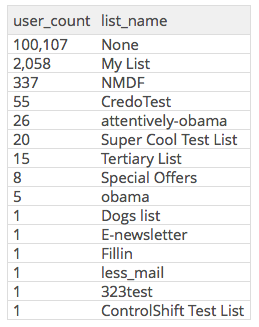
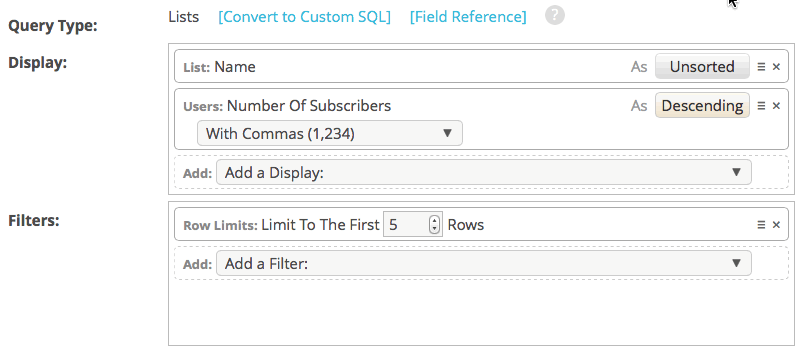
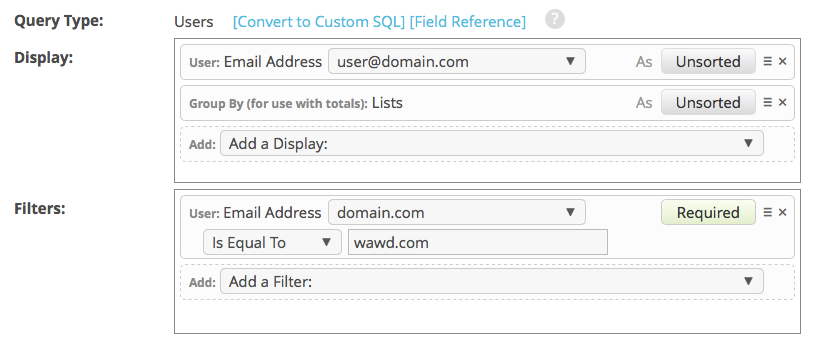
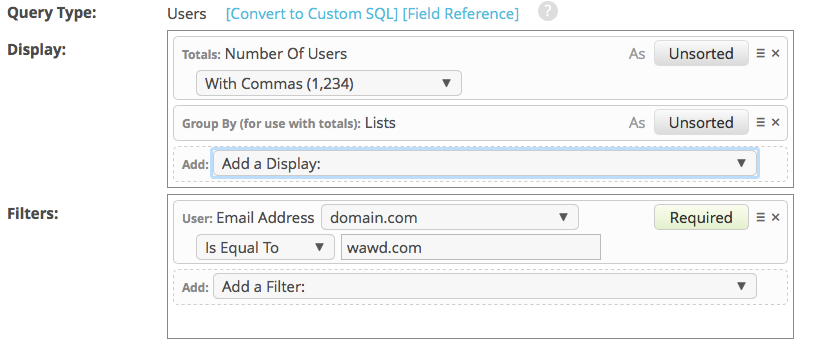
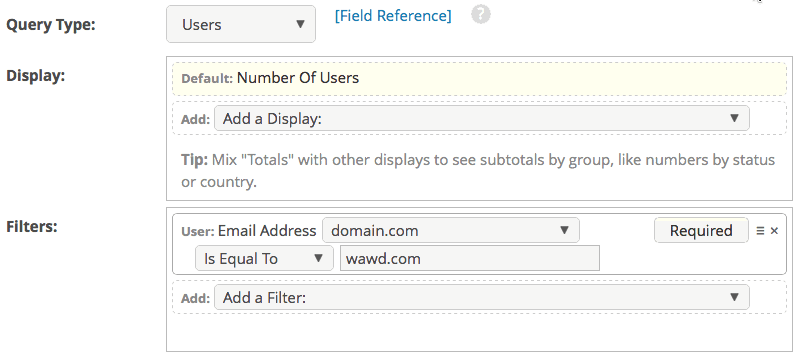
Here’s an example query to show the number of users subscribed to each mailing list, starting from Users:
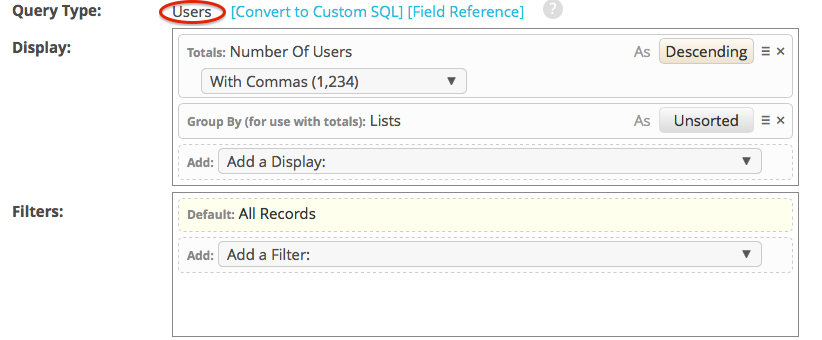
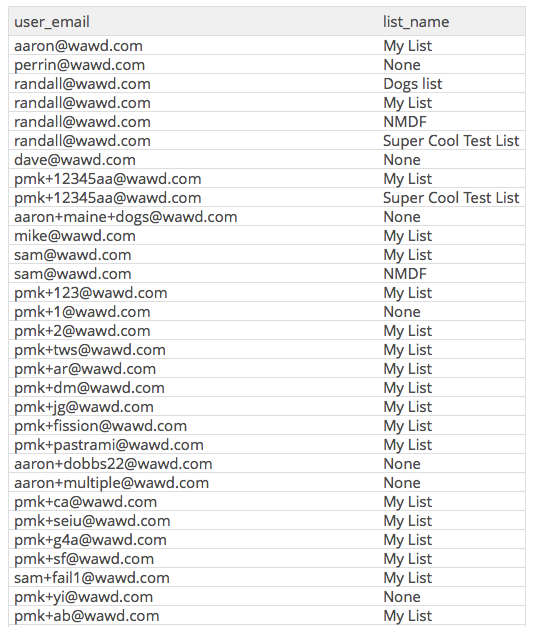
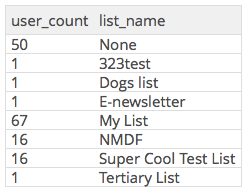
Note that the results include the number of users who aren’t subscribed to any mailing list:
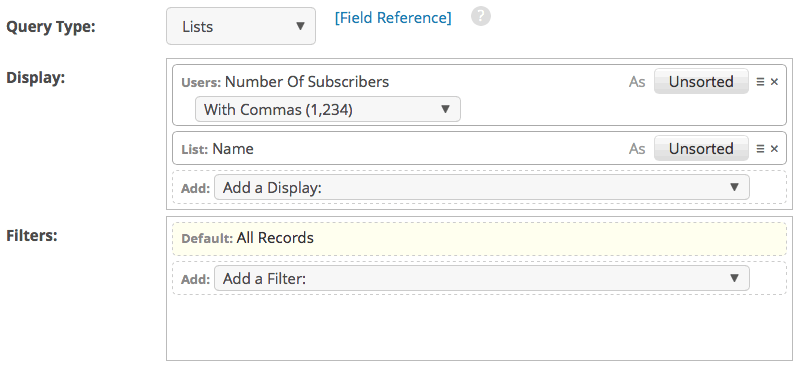
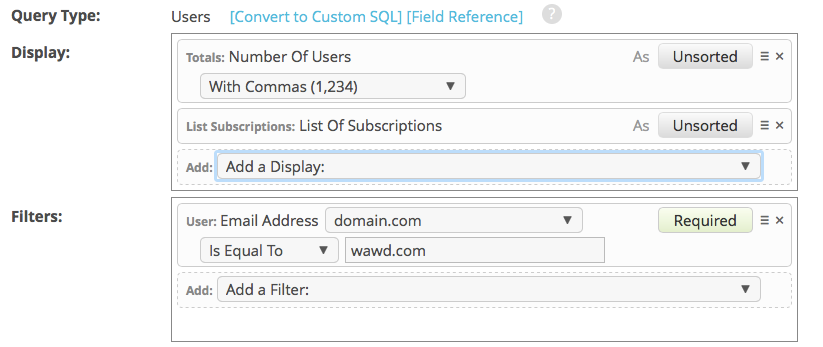
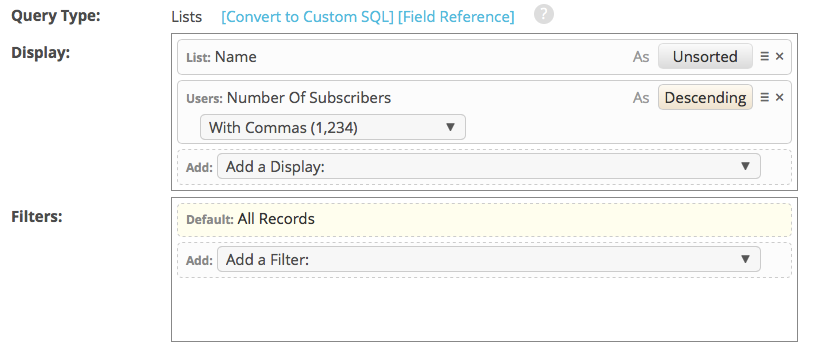
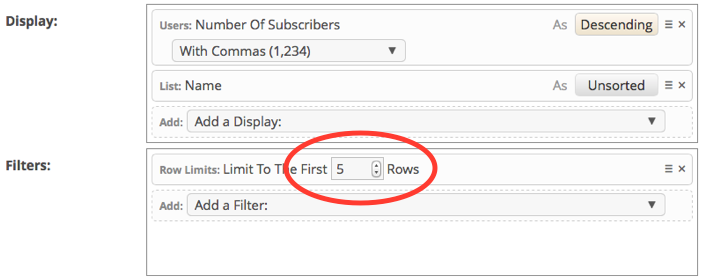
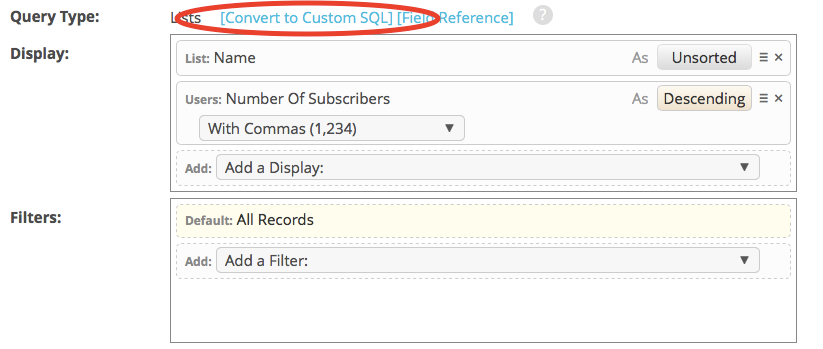
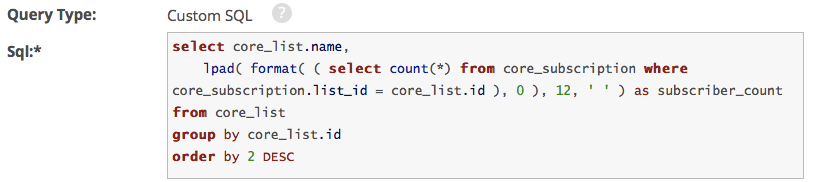
And here’s an similar search starting from Lists:
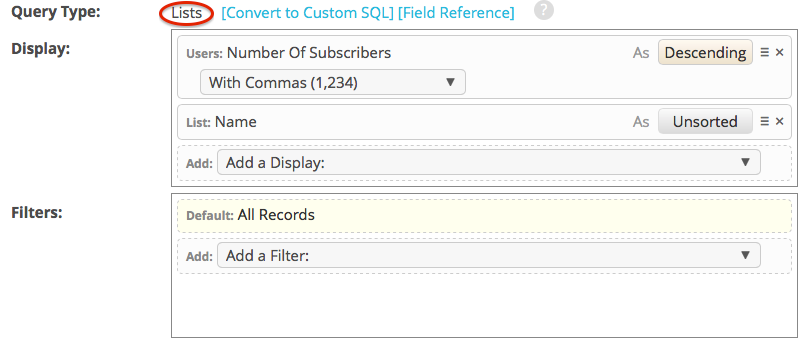
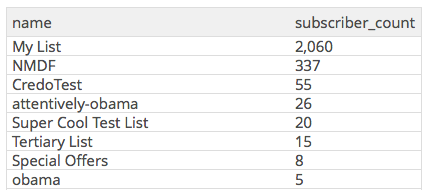
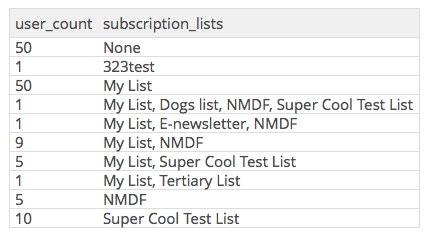
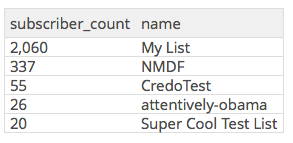
These results include mailing lists which don’t have any subscribers:
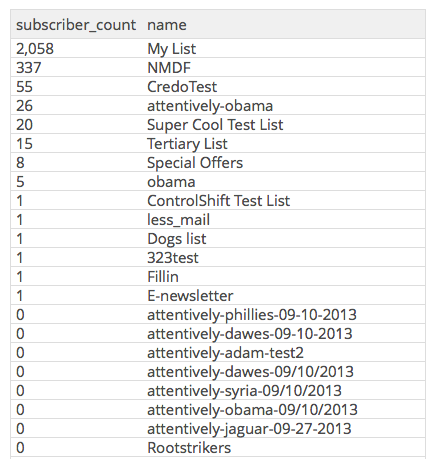
(Also, in this case, the second version of this query starting from Lists runs approximately seven times faster than the first one starting from Users.)
Display Columns
The Display Columns area lets you choose the columns to be displayed when you run the report.
Click on Add a Display to view the available options. Once you’ve made a selection, repeat to add additional displays.
All displays include some common controls:
Click on the × icon to remove a display.
Click and drag the ≡ icon to change the order in which the columns are displayed.
To provide a custom column name, click As and enter the column name you’d like to use for this display.
To define a sort order for the column, click Unsorted and toggle to Ascending or Descending.
To make a display item affect the sorting but not generate an output column, hold down the shift key when clicking the sorting button, which will cause an “Invisible, Sort Only” indicator to appear.
Changing Column Order
Display columns show up in the order in which you add them to the query.
To change the order of the columns, start by clicking the “≡” symbol on the right side and hold the mouse button down while you drag and drop it into a new position:
When you save the report, the results will show up with the columns in the order you have selected:
Changing Column Names
The query builder often uses long column names, which show up in your report or CSV. This helps to keep them distinct if you have several similar types of columns next to each other in a single report.
However, you can choose a new column name if you’d like. Start by clicking on the “As” text and a field appears to let you enter a new column alias; setting the alias to blank to revert to the default name.
Choosing A Sort Order
If you don’t choose a sort order, the database selects one for you, which may be the order records were created, or may be seemingly random.
Click the sort order button in any column to toggle it and the sort order will cycle from “Unsorted” to “Ascending”, then “Descending”, and return to “Unsorted”:
When sorting on multiple columns, the first one is most significant, later ones are used as tie-breakers.
Display Variations
Many displays include variables or formatting options that you can adjust. You’ll see these as soon as you select the display.
For example, in a Users report if you select the display type Lifetime Action Count, you’ll see a dropdown with All Actions selected by default. You can change this to:
Completed Actions - only those with a “completed” status in core_action,
Completed Non-import - status completed and not an action on an Import page,
Completed Significant Actions - status completed and not an action on an Import, Unsubscribe, or Recurring Donation Management page, or
Completed Petition Actions - completed action on a Petition Page.
Totals And Subtotals
The first category in the Display menu is labeled Totals. Choose displays from this category to see aggregate statistics for all records that meet your filter choices, or mix these displays with other choices to see statistics by group.
Each query builder type has one or several types of totals which it can generate: record counts, sums of order amounts, average click-through percentage, etc.
Totals and non-total displays interact as follows:
If your report contains only totals display, it will show a single row of grand totals for all records matched by the filters.
If your report contains a mix of totals and non-totals displays, it will show the totals values grouped by the distinct values of the non-total displays.
If your report contains only non-totals displays, it will show a row for each record matched by the filters.
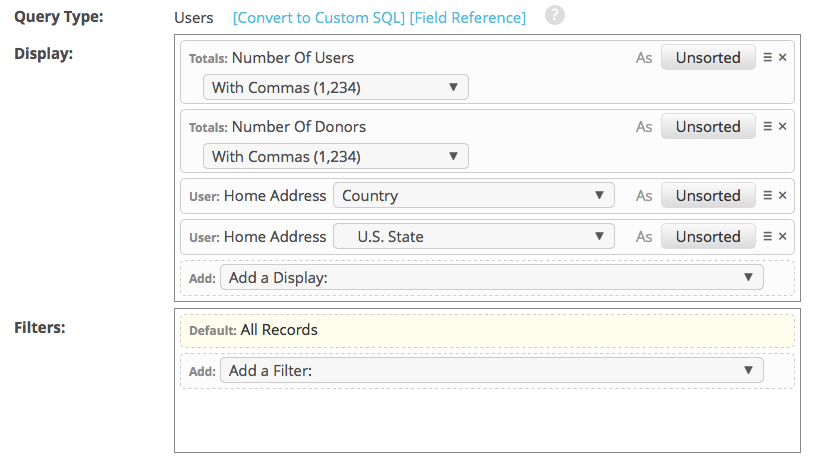
For example, in a Users report:
Choose Number of users to create a report that returns one row with a total count of users matching the filter criteria.
Choose both Number of users and Country to see a row for each country followed by the number of users in that country.
Choose Country to get a report that returns a row for each matching user showing the name of their country.
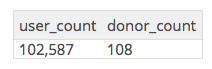
Here’s an example of a query that contains only totals displays:
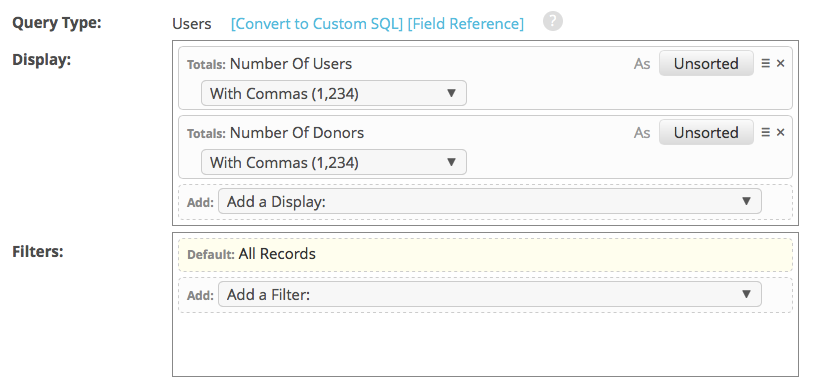
The results will provide a grand total for those figures:
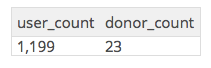
You can combine totals displays with filter criteria:
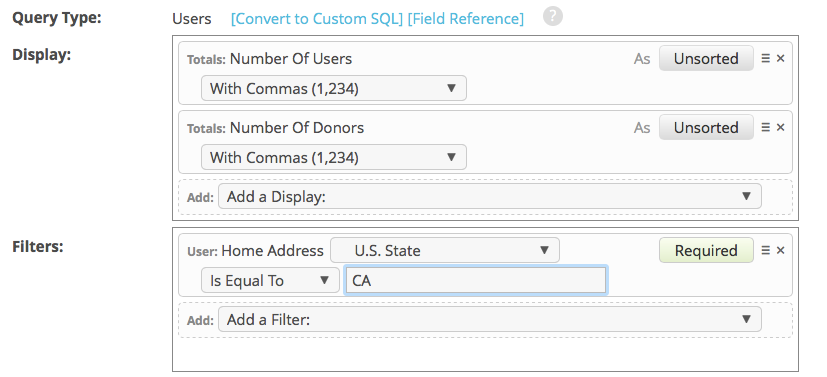
This will yield totals based on only the matching records:
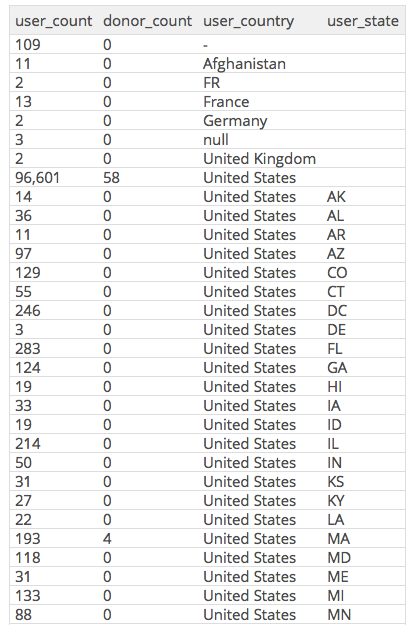
You can also combine a totals display with one or more other display columns:
The results will show subtotals grouped by the other display values:
Repeating Value Displays
Some displays generate lists of multiple values, such as a list of a user’s tags, or a list of the tags from actions they’ve taken, or a list of hosts and attendees for an event.
Some of these are available in two versions, one that displays a single, comma-separated value, plus another that generates multiple rows, with each value producing a new row.
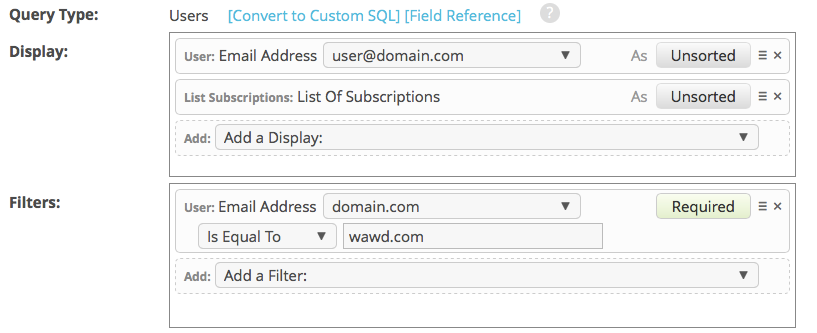
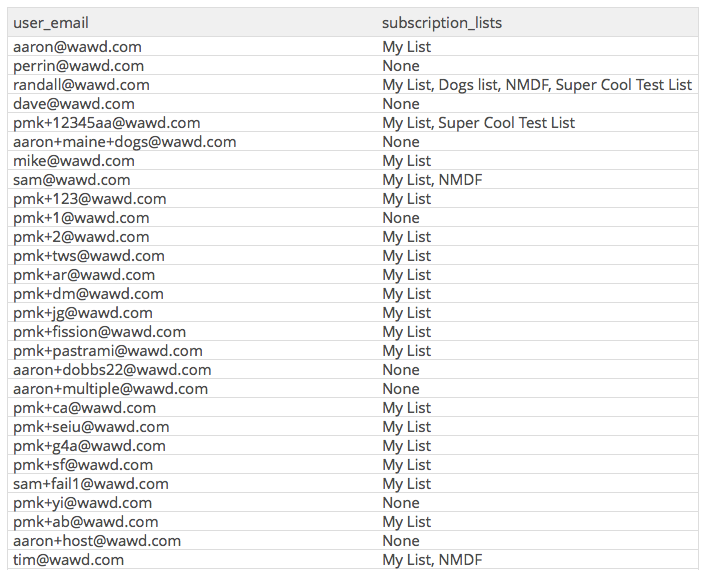
Here’s an example of a list display that produces a single value:
The results display one row for each user along with all of their subscriptions:
There’s an equivalent repeating display type:
Now we get multiple row for users who have more than one subscription:
You can request totals for a single-value list display:
This produces sub-totals for each unique combination:
The repeating display type can also be used with totals:
That yields separate counts for each mailing list, without combinations:
Custom SQL Display Expressions
The last category in the Add a Display menu is labeled SQL Expression and is available in all query-builder types. It contains a Custom SQL choice that will allow you to enter a fragment of SQL to be included in the query’s SELECT clause. Change the Expression dropdown to With Join to add a JOIN clause, or choose Aggregate if your expression contains a group function like COUNT() or SUM(), or Group By if your expression should be included in the query’s GROUP BY clause.
This feature can be useful when the query builder yields SQL that’s almost right, but not exactly what you need, and you don’t want to give up the flexibility of continuing to edit it with the query builder.
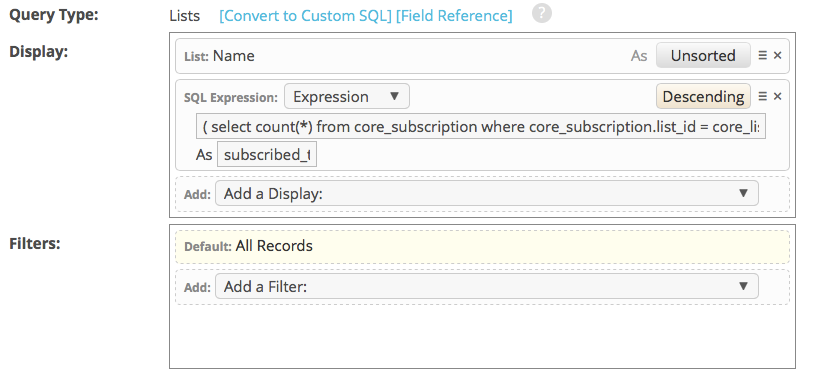
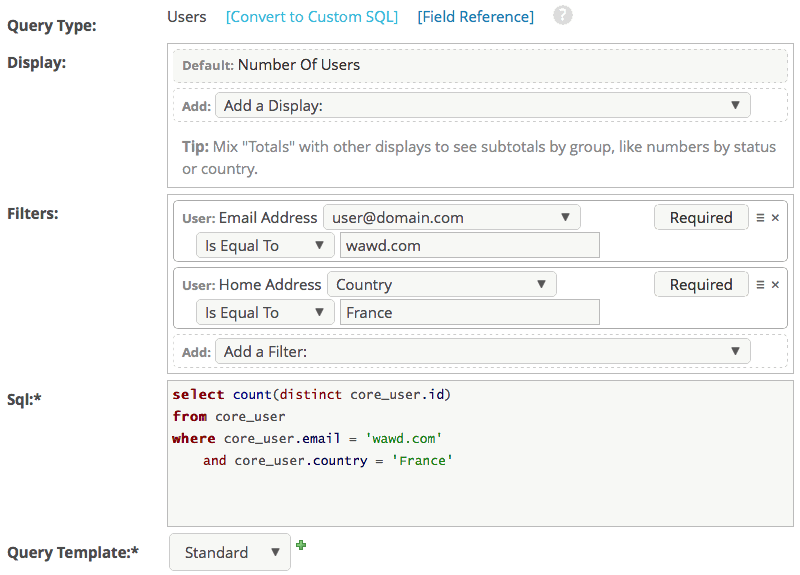
Here’s an example of a simple query builder report:
By adding a “custom SQL expression” display, and copying in the generated SQL for one of the columns, we can produce an equivalent report:
The SQL expression can then be edited as needed.
Filter Criteria
The Filter Criteria area controls which database rows will be included in the report. These choices are used to determine the WHERE criteria in the generated SQL.
By default, all rows are included. Click on Add a Filter to limit the rows returned.
All filters include some common controls:
Click on the × icon to remove a filter.
Click and drag the ≡ to change the order in which the filters appear.
To exclude rows based on a filter, click on the green Required button to toggle it to Excluded, which adds a
NOT()around this filter in the SQLWHEREclause.
Many filter types include variables that you can adjust. Leaving those variables empty will turn them into input parameters to be entered when the report is run. This works for any of the filter fields with a text box. For example, in the action report builder, if you want to create a report showing action counts with a given source on a given page, select the source and page options and leave the text boxes blank. To run the report staffers will need to enter the source and page name or id.
The last categories of filters in the Add a Filter menu are labeled SQL Expression and Row Limits, which are features that are available in all query-builder types.
The Custom SQL choice will allow you to enter a fragment of SQL to be included in the query’s
WHEREclause. Change the Expression dropdown to With Join to add aJOINclause, or choose Having if your expression uses the results of a display field with an aggregate function likeCOUNT()orSUM().The Any (OR) and All (AND) choices allow you to group other filter criteria together. When you add an
ORorANDfilter item, it will contain an area labeled Grab criteria by their ≡ handle to drag into this box. Drag and drop other filter rows into that box to group them together.The Limit to the first [100] rows choices allow you control the number of matching rows included in your report by setting
LIMITandOFFSETvalues to be included in your SQL.
Excluded Filter Criteria
Filter criteria default to “require”: you only get results for rows that match the filters.
But you can toggle a filter to “exclude” mode, to get all of the rows that don’t match that criteria.
Just click on the “Required” button to change it to “Excluded”; clicking it again will toggle it back to “Required”:
Limiting Result Rows
If you don’t set a limit, the database selects all matching rows.
To control the number of results you receive, add a filter of “Limit To The First ___ Rows” and choose a number.
Your results will then be limited to the number of rows you selected:
Structured Filter Criteria
When you have multiple filters, they’re interpreted as “require all”: you only get rows back if they match all of the filters.
But you can use OR and AND criteria to combine filters into a more complex structure.
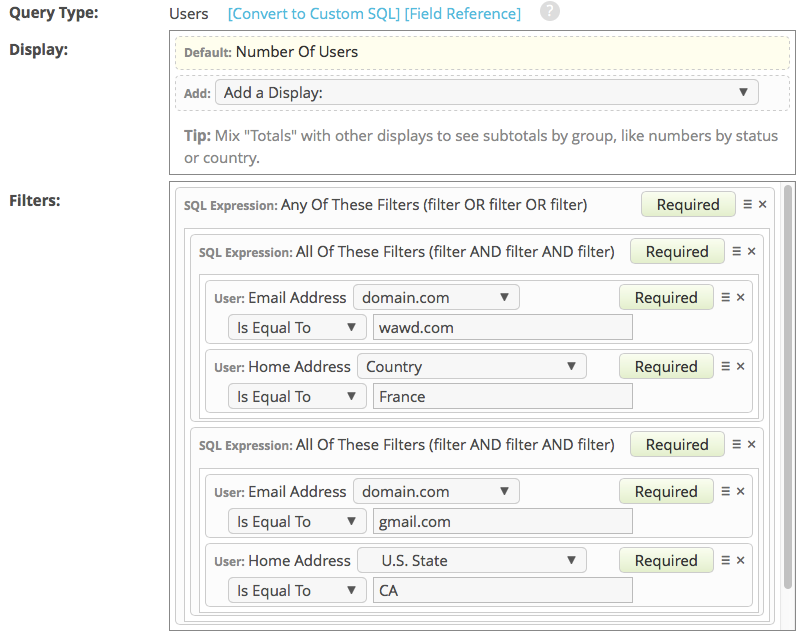
Start by adding some of the filters you’ll need, then add an “Any of these (OR)” filter. Click and hold the “≡” symbol to drag it into the content area of the OR filter to produce a filter that accepts rows which meet either of the two filter rules:
You can nest AND and OR filters to produce complex criteria:
Creating Report Parameters
When you’re constructing filters, you can create report parameters to be specified at run-time. Normally you create run-time parameters in the query builder by leaving a QB input field blank, and allowing it to generate a parameter name for you. Alternately, you can specify your own parameter names in the query builder by filling the input fields with a parameter name wrapped in double curly brackets, like {{ city }} and {{ state }}, or whatever other parameter names you would like to use. The alternate method works for text, number, and date fields.
Rather than building in a single value as part of the report’s definition, users will be able to enter a value each time they run the report.
Here’s an example of a filter where the matching criteria has been left blank:
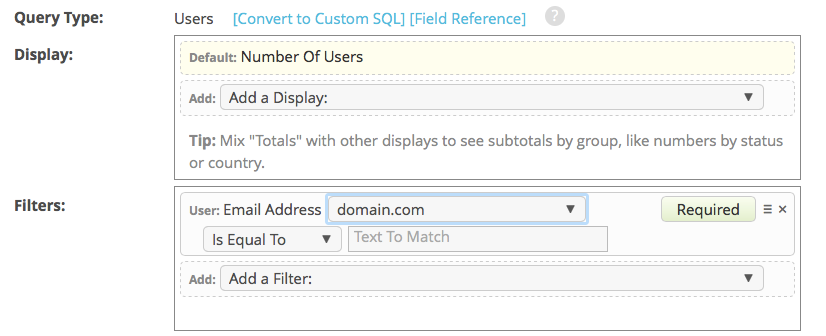
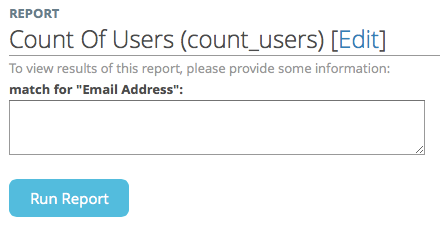
When a user runs this report they will be prompted to enter a value to match against:
Renaming Query Builder Parameters
There are two techniques you can use within the QB to provide friendlier labels for these parameters when users run the generated reports:
For fields that take a text or numeric value, you can just click in the relevant field and enter “{{ Number_of_Months }}” or some other label in that format.
For fields that have a type-to-search lookup interface, the process is more awkward:
Scroll through the box showing the generated SQL for your query to find the parameter name, which may have different capitalization than shown when you run the report, and which uses underscores instead of spaces, like
List_ids_for_Is_Subscribed_to_List_IDs.In the “Filter Criteria” box, click Add > Custom SQL, then change the pull-down menu from “Where” to “Custom Preface” and enter an expression that looks like the below, replacing “Choose Lists” with your preferred label:
{% required_parameter "List_ids_for_Is_Subscribed_to_List_IDs" label "Choose Lists" %}. Note that the “Custom Preface” approach also lets you control parameter order, attach hint text to appear below the parameter value input, and define default values that will be shown when the report form is presented.
Custom SQL Filter Expressions
Near the end of the Add a Filter menu is a category labeled SQL Expression which is available in all query-builder types. It contains a Custom SQL choice that will allow you to enter a fragment of SQL to be included in the query’s WHERE clause. Change the Where dropdown to Where With Join to add a JOIN clause, or choose Having if your expression operates on the results of a group function like COUNT() or SUM().
The Custom SQL choice option also includes a few Other options which may be useful in some specialized cases.
Choose Explain to have the database return a query plan showing which tables it will examine to perform the query, and which indexes will be used; this can be useful when trying to understand why a query is running slowly.
Choose Big Selects to set the sql_big_selects option which instructs the database to ignore the default MAX_JOIN_SIZE limit; you may need to include this if you are querying a large table such as core_usermailing.
The Custom Preface and Custom Postface options allow you to insert arbitrary SQL expressions before and after the main portion of your query.
Time Zone Adjustments
You can use named time zones in query reports to adjust dates and times from the GMT format ActionKit uses internally to a time zone that makes sense for your organization, while respecting daylight-savings rules.
When using the query builder, you’ll see time zone options in two kinds of places:
Display and filtering of datetime fields, eg Users > User > Date and Time [Created/Updated].
Display and filtering of count and list fields that support timespans, eg Users > Actions > Number Of Actions, if you chose a timespan other than “On Any Date”.
The query builder’s time zone menu defaults to GMT, which doesn’t require any conversion, or you can choose from a few common values that cover most of the US and Europe; from west to east, they are: US/Hawaii, US/Alaska, US/Pacific, US/Arizona, US/Mountain, US/Central, US/Eastern, Europe/London, Europe/Berlin, and Europe/Athens.
If you routinely use a time zone that is not included in the query builder menu, let us know and we’ll add it to our list!
There’s also an “Other” choice which reveals a field where you can enter any of the time zone names in the industry-standard “tz” database, most of which are in region/city format, such as ‘Canada/Newfoundland’, ‘Africa/Cairo’, and ‘Asia/Tokyo’. You can also use country names like “Egypt” or “Japan”, although not every country is included, and sometimes the name is not what you might expect, eg Ireland is listed as “Eire”. A list of standard time zone names is available here:
Converting to Custom SQL
Sometimes the query builder yields SQL that’s almost right, but not exactly what you need.
You can convert the query to a Custom SQL report, and then edit the SQL as you’d like.
(However, this is a one-way transition; you can’t switch back to the query builder and recover your original configuration.)
Here’s an example of a report that has been constructed with the query builder:
After clicking “Convert to Custom SQL” you’ll be able to edit the generated SQL directly:
Query Builder SQL Reference
Click here to view the SQL expressions used by the query builder.
Query Builder Examples
For some examples of query builder reports, click here to look at the built-in ones.